1 + 1[1] 2print(1 + 1)[1] 2print() 展示数据的前面几列、前面几行print_headtail() 展示数据的前面几列、首尾几行print_interval() 展示数据的前面几列、均匀分布的几行glimpse() 展示数据每一列的前面几行view() 和 browse() 打开类似 Excel 的界面,查看数据表格flextable::as_flextable() 打开类似网页的界面,查看数据表格,也可以进一步美化、输出variables(), names() 和 ds() 浏览变量名variables_search() 根据变量名或变量标签搜索变量codebook() 查看变量标签和概要codebook_detail() 查看详细的变量和数值标签print()当你键入一个对象,而不对它进行任何操作时,R 会自动帮你套上一个 print() 函数。请看下面的例子:
1 + 1[1] 2print(1 + 1)[1] 2同理,我们阅读 diamonds 的时候,其实是看它打印出来的样子:
library(tidyverse)

diamonds
# A tibble: 53,940 × 10
carat cut color clarity depth table price x y z
<dbl> <ord> <ord> <ord> <dbl> <dbl> <int> <dbl> <dbl> <dbl>
1 0.23 Ideal E SI2 61.5 55 326 3.95 3.98 2.43
2 0.21 Premium E SI1 59.8 61 326 3.89 3.84 2.31
3 0.23 Good E VS1 56.9 65 327 4.05 4.07 2.31
4 0.29 Premium I VS2 62.4 58 334 4.2 4.23 2.63
5 0.31 Good J SI2 63.3 58 335 4.34 4.35 2.75
6 0.24 Very Good J VVS2 62.8 57 336 3.94 3.96 2.48
7 0.24 Very Good I VVS1 62.3 57 336 3.95 3.98 2.47
8 0.26 Very Good H SI1 61.9 55 337 4.07 4.11 2.53
9 0.22 Fair E VS2 65.1 61 337 3.87 3.78 2.49
10 0.23 Very Good H VS1 59.4 61 338 4 4.05 2.39
# ℹ 53,930 more rowsprint(diamonds) # equivalent# A tibble: 53,940 × 10
carat cut color clarity depth table price x y z
<dbl> <ord> <ord> <ord> <dbl> <dbl> <int> <dbl> <dbl> <dbl>
1 0.23 Ideal E SI2 61.5 55 326 3.95 3.98 2.43
2 0.21 Premium E SI1 59.8 61 326 3.89 3.84 2.31
3 0.23 Good E VS1 56.9 65 327 4.05 4.07 2.31
4 0.29 Premium I VS2 62.4 58 334 4.2 4.23 2.63
5 0.31 Good J SI2 63.3 58 335 4.34 4.35 2.75
6 0.24 Very Good J VVS2 62.8 57 336 3.94 3.96 2.48
7 0.24 Very Good I VVS1 62.3 57 336 3.95 3.98 2.47
8 0.26 Very Good H SI1 61.9 55 337 4.07 4.11 2.53
9 0.22 Fair E VS2 65.1 61 337 3.87 3.78 2.49
10 0.23 Very Good H VS1 59.4 61 338 4 4.05 2.39
# ℹ 53,930 more rows所以,我们通常不会主动使用 print()。
我们还可以用 statart 包的 print_headtail() 和 print_interval() 函数。前者可以打印一个数据的开头几行和结尾几行,后者可以等间距地抽几行(有点像系统抽样)打印:
library(statart)

print_headtail(diamonds)
# A tibble: 53,940 × 10
carat cut color clarity depth table price x y z
<dbl> <ord> <ord> <ord> <dbl> <dbl> <int> <dbl> <dbl> <dbl>
1 0.23 Ideal E SI2 61.5 55 326 3.95 3.98 2.43
2 0.21 Premium E SI1 59.8 61 326 3.89 3.84 2.31
3 0.23 Good E VS1 56.9 65 327 4.05 4.07 2.31
4 0.29 Premium I VS2 62.4 58 334 4.2 4.23 2.63
5 0.31 Good J SI2 63.3 58 335 4.34 4.35 2.75
53936 0.72 Ideal D SI1 60.8 57 2757 5.75 5.76 3.5
53937 0.72 Good D SI1 63.1 55 2757 5.69 5.75 3.61
53938 0.7 Very Good D SI1 62.8 60 2757 5.66 5.68 3.56
53939 0.86 Premium H SI2 61 58 2757 6.15 6.12 3.74
53940 0.75 Ideal D SI2 62.2 55 2757 5.83 5.87 3.64
# ℹ 53,930 more rows in the middle
# ℹ Use `print_headtail(n = ...)` to see more rowsprint_headtail(diamonds, n = 20)# A tibble: 53,940 × 10
carat cut color clarity depth table price x y z
<dbl> <ord> <ord> <ord> <dbl> <dbl> <int> <dbl> <dbl> <dbl>
1 0.23 Ideal E SI2 61.5 55 326 3.95 3.98 2.43
2 0.21 Premium E SI1 59.8 61 326 3.89 3.84 2.31
3 0.23 Good E VS1 56.9 65 327 4.05 4.07 2.31
4 0.29 Premium I VS2 62.4 58 334 4.2 4.23 2.63
5 0.31 Good J SI2 63.3 58 335 4.34 4.35 2.75
6 0.24 Very Good J VVS2 62.8 57 336 3.94 3.96 2.48
7 0.24 Very Good I VVS1 62.3 57 336 3.95 3.98 2.47
8 0.26 Very Good H SI1 61.9 55 337 4.07 4.11 2.53
9 0.22 Fair E VS2 65.1 61 337 3.87 3.78 2.49
10 0.23 Very Good H VS1 59.4 61 338 4 4.05 2.39
53931 0.71 Premium E SI1 60.5 55 2756 5.79 5.74 3.49
53932 0.71 Premium F SI1 59.8 62 2756 5.74 5.73 3.43
53933 0.7 Very Good E VS2 60.5 59 2757 5.71 5.76 3.47
53934 0.7 Very Good E VS2 61.2 59 2757 5.69 5.72 3.49
53935 0.72 Premium D SI1 62.7 59 2757 5.69 5.73 3.58
53936 0.72 Ideal D SI1 60.8 57 2757 5.75 5.76 3.5
53937 0.72 Good D SI1 63.1 55 2757 5.69 5.75 3.61
53938 0.7 Very Good D SI1 62.8 60 2757 5.66 5.68 3.56
53939 0.86 Premium H SI2 61 58 2757 6.15 6.12 3.74
53940 0.75 Ideal D SI2 62.2 55 2757 5.83 5.87 3.64
# ℹ 53,920 more rows in the middle
# ℹ Use `print_headtail(n = ...)` to see more rowsprint_interval(diamonds)# A tibble: 53,940 × 10
carat cut color clarity depth table price x y z
<dbl> <ord> <ord> <ord> <dbl> <dbl> <int> <dbl> <dbl> <dbl>
1 0.23 Ideal E SI2 61.5 55 326 3.95 3.98 2.43
5994 0.71 Ideal G VVS1 61.1 57 3955 5.76 5.8 3.53
11987 1.09 Ideal F SI2 61.6 55 5143 6.59 6.65 4.08
17981 1.7 Ideal H SI2 62.1 57 7273 7.68 7.63 4.75
23974 1.53 Ideal F SI1 61.6 56 12109 7.39 7.34 4.54
29967 0.31 Good H SI1 63.6 57 446 4.32 4.33 2.75
35960 0.33 Very Good H SI1 63 57 475 4.39 4.41 2.77
41954 0.23 Very Good E VVS2 61.6 61 505 3.92 3.97 2.43
47947 0.71 Very Good J SI1 63.5 58 1917 5.63 5.67 3.59
53940 0.75 Ideal D SI2 62.2 55 2757 5.83 5.87 3.64
# ℹ 53,930 more rows between the intervals
# ℹ Use `print_interval(n = ...)` to see more rowsprint_interval(diamonds, n = 20)# A tibble: 53,940 × 10
carat cut color clarity depth table price x y z
<dbl> <ord> <ord> <ord> <dbl> <dbl> <int> <dbl> <dbl> <dbl>
1 0.23 Ideal E SI2 61.5 55 326 3.95 3.98 2.43
2840 0.9 Good G SI2 58.4 55 3269 6.34 6.39 3.72
5679 1.01 Very Good I SI2 61.8 60 3885 6.34 6.37 3.93
8518 1.04 Ideal F SI1 62.1 56 4426 6.54 6.47 4.04
11357 0.99 Very Good D SI2 62.5 57 4993 6.3 6.34 3.95
14195 1.06 Ideal F SI1 62.1 57 5758 6.53 6.51 4.05
17034 1 Ideal F VS2 62.6 57 6804 6.4 6.35 3.99
19873 1.52 Premium J VS1 62.2 59 8426 7.32 7.38 4.57
22712 1.53 Premium I VS1 62.4 59 10729 7.3 7.34 4.57
25551 1.6 Very Good G VS2 61 57 14383 7.55 7.59 4.62
28390 0.33 Ideal H VS2 60.7 57 668 4.48 4.45 2.71
31229 0.32 Good D SI1 63.6 56 756 4.37 4.34 2.77
34068 0.3 Premium D VS2 62 62 851 4.27 4.24 2.64
36907 0.42 Ideal G VVS2 62.3 53 961 4.83 4.86 3.02
39746 0.53 Ideal G SI2 62.4 56 1093 5.18 5.14 3.22
42584 0.52 Ideal E SI1 61.4 57 1330 5.15 5.18 3.17
45423 0.55 Ideal E SI1 61.4 55 1668 5.29 5.26 3.24
48262 0.53 Ideal G VVS2 60.8 57 1955 5.24 5.28 3.2
51101 0.56 Very Good G VVS2 62.1 55.6 2336 5.29 5.31 3.29
53940 0.75 Ideal D SI2 62.2 55 2757 5.83 5.87 3.64
# ℹ 53,920 more rows between the intervals
# ℹ Use `print_interval(n = ...)` to see more rowsvariables() 和 variables_search()variables(diamonds)# A tibble: 10 × 1
name
<chr>
1 carat
2 cut
3 color
4 clarity
5 depth
6 table
7 price
8 x
9 y
10 z variables(lifeexp)# A tibble: 6 × 2
name label
<chr> <chr>
1 region Region
2 country Country
3 popgrowth Avg. annual % growth
4 lexp Life expectancy at birth
5 gnppc GNP per capita
6 safewater Safe water variables_search(lifeexp, "e")# A tibble: 3 × 2
name label
<chr> <chr>
1 region Region
2 lexp Life expectancy at birth
3 safewater Safe water names() 和 ds()library(tidyverse)
# 罗列变量名
names(diamonds) [1] "carat" "cut" "color" "clarity" "depth" "table" "price"
[8] "x" "y" "z" names_as_column(diamonds)# A tibble: 10 × 1
name
<chr>
1 carat
2 cut
3 color
4 clarity
5 depth
6 table
7 price
8 x
9 y
10 z ds(diamonds, 1:5)[1] "carat" "cut" "color" "clarity" "depth" ds_as_column(diamonds, 1:5)# A tibble: 5 × 1
name
<chr>
1 carat
2 cut
3 color
4 clarity
5 depth glimpse()# 浏览变量列表,以及开头的若干个案
glimpse(diamonds)Rows: 53,940
Columns: 10
$ carat <dbl> 0.23, 0.21, 0.23, 0.29, 0.31, 0.24, 0.24, 0.26, 0.22, 0.23, 0.…
$ cut <ord> Ideal, Premium, Good, Premium, Good, Very Good, Very Good, Ver…
$ color <ord> E, E, E, I, J, J, I, H, E, H, J, J, F, J, E, E, I, J, J, J, I,…
$ clarity <ord> SI2, SI1, VS1, VS2, SI2, VVS2, VVS1, SI1, VS2, VS1, SI1, VS1, …
$ depth <dbl> 61.5, 59.8, 56.9, 62.4, 63.3, 62.8, 62.3, 61.9, 65.1, 59.4, 64…
$ table <dbl> 55, 61, 65, 58, 58, 57, 57, 55, 61, 61, 55, 56, 61, 54, 62, 58…
$ price <int> 326, 326, 327, 334, 335, 336, 336, 337, 337, 338, 339, 340, 34…
$ x <dbl> 3.95, 3.89, 4.05, 4.20, 4.34, 3.94, 3.95, 4.07, 3.87, 4.00, 4.…
$ y <dbl> 3.98, 3.84, 4.07, 4.23, 4.35, 3.96, 3.98, 4.11, 3.78, 4.05, 4.…
$ z <dbl> 2.43, 2.31, 2.31, 2.63, 2.75, 2.48, 2.47, 2.53, 2.49, 2.39, 2.…view()# 打开 Excel 式的数据表
view(diamonds)
# browse() 功能更强大,可以选择特定变量
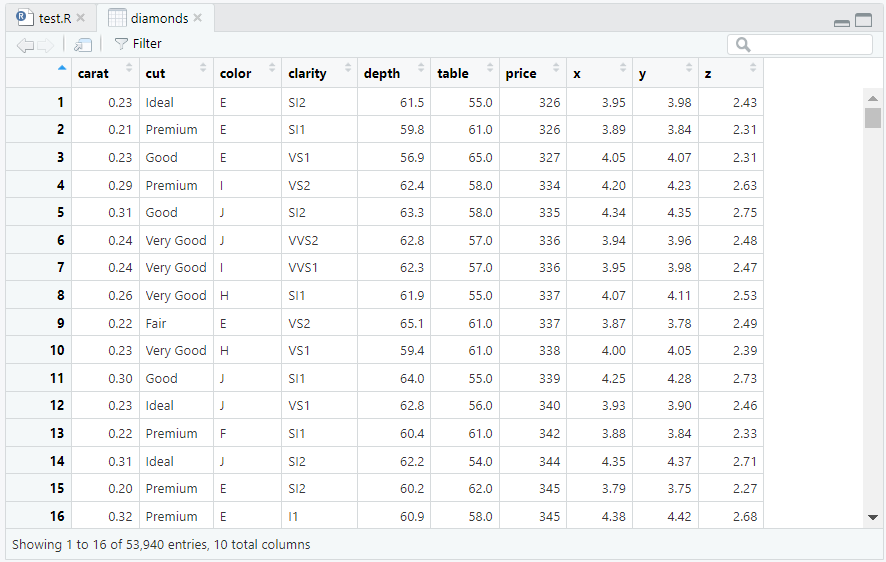
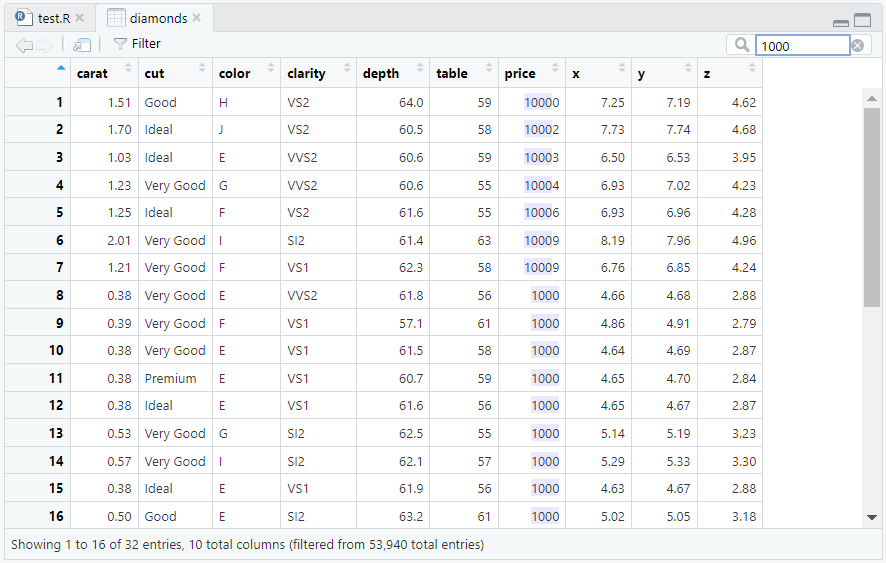
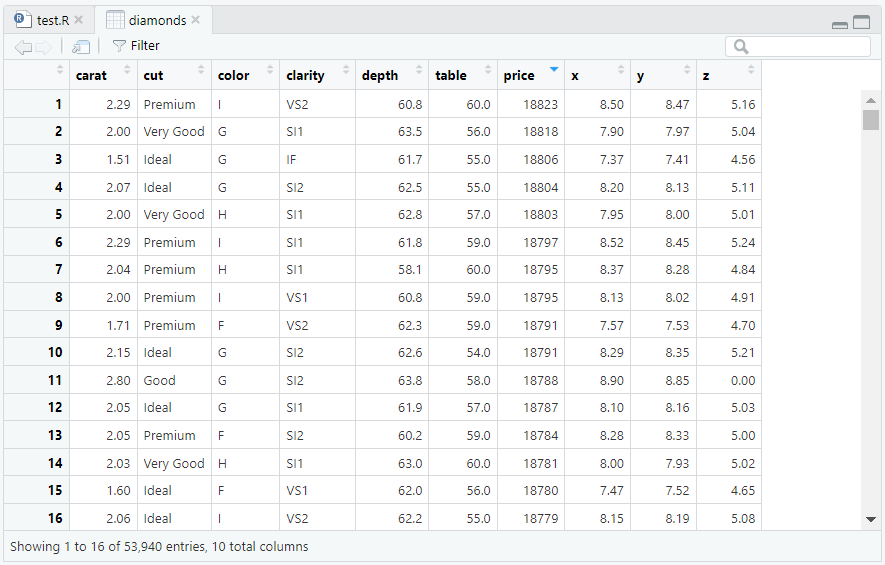
browse(diamonds, 1:3)这里因为条件的限制无法演示,就在下面贴一些截图吧。大家可以在自己的 RStudio 里面运行代码,尝试一下。


codebook()library(statart)
# 查看变量基本信息
codebook(diamonds)# A tibble: 10 × 4
variable type n unique
<chr> <chr> <int> <int>
1 carat double 53940 273
2 cut ordered 53940 5
3 color ordered 53940 7
4 clarity ordered 53940 8
5 depth double 53940 184
6 table double 53940 127
7 price integer 53940 11602
8 x double 53940 554
9 y double 53940 552
10 z double 53940 375# 查看变量详细信息
codebook_detail(diamonds)id | name | type | missings | values | n | prop | row_id |
|---|---|---|---|---|---|---|---|
character | character | character | character | character | character | character | integer |
1 | carat | numeric | 0 (0.0%) | [0.2, 5.01] | 53940 | 1 | |
1 | |||||||
2 | cut | ordinal | 0 (0.0%) | Fair | 1610 | 3.0% | 2 |
Good | 4906 | 9.1% | 2 | ||||
Very Good | 12082 | 22.4% | 2 | ||||
Premium | 13791 | 25.6% | 2 | ||||
Ideal | 21551 | 40.0% | 2 | ||||
2 | |||||||
3 | color | ordinal | 0 (0.0%) | D | 6775 | 12.6% | 3 |
E | 9797 | 18.2% | 3 | ||||
F | 9542 | 17.7% | 3 | ||||
G | 11292 | 20.9% | 3 | ||||
H | 8304 | 15.4% | 3 | ||||
I | 5422 | 10.1% | 3 | ||||
J | 2808 | 5.2% | 3 | ||||
3 | |||||||
4 | clarity | ordinal | 0 (0.0%) | I1 | 741 | 1.4% | 4 |
SI2 | 9194 | 17.0% | 4 | ||||
SI1 | 13065 | 24.2% | 4 | ||||
VS2 | 12258 | 22.7% | 4 | ||||
VS1 | 8171 | 15.1% | 4 | ||||
VVS2 | 5066 | 9.4% | 4 | ||||
VVS1 | 3655 | 6.8% | 4 | ||||
IF | 1790 | 3.3% | 4 | ||||
4 | |||||||
5 | depth | numeric | 0 (0.0%) | [43, 79] | 53940 | 5 | |
5 | |||||||
6 | table | numeric | 0 (0.0%) | [43, 95] | 53940 | 6 | |
6 | |||||||
7 | price | integer | 0 (0.0%) | [326, 18823] | 53940 | 7 | |
7 | |||||||
8 | x | numeric | 0 (0.0%) | [0, 10.74] | 53940 | 8 | |
8 | |||||||
9 | y | numeric | 0 (0.0%) | [0, 58.9] | 53940 | 9 | |
9 | |||||||
10 | z | numeric | 0 (0.0%) | [0, 31.8] | 53940 | 10 | |
10 | |||||||
n: 37 | |||||||